Illinois has the highest commuter crash risk in the country at 11.4 fatal crashes for every 10,000 commuters, more than three times Oklahoma’s rate of 3.3 per 10,000. The rankings come from a state-by-state analysis of five-year crash and commuting data from NHTSA and the U.S. Bureau of Labor Statistics.
Commuters in the U.S. lose an average of 43 hours a year, equal to a full work week, sitting in traffic, according to the 2025 INRIX Global Traffic Scorecard. Morning and evening rush hours carry extra risk from fatigue, distraction, congestion, and stress. A recent study by Hasbrook & Hasbrook compared commutes across the U.S. to identify the states where commuting puts people at the greatest risk. The study drew on five-year crash totals from the National Highway Traffic Safety Administration, average commute time, and public transit use from the U.S. Bureau of Labor Statistics to calculate fatal crashes per 10,000 commuters in each state. These figures do not include non-fatal crashes, which happen far more often.
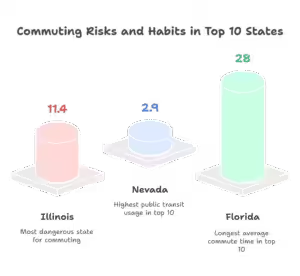
- Illinois is the most dangerous state for commuting, with 11.4 fatal crashes for every 10,000 commuters.
- Nevada commuters use public transit more than any other state in the top 10, at 2.9%.
- Florida has the longest average commute in the top 10, at 28 minutes.



The 10 States With the Highest Commuter Fatality Rates
| State | Commute Time (Minutes) | Crashes per 10,000 Commuters |
|---|---|---|
| Illinois | 21 | 11.4 |
| Wisconsin | 18 | 11.2 |
| Vermont | 23 | 7.1 |
| Tennessee | 25 | 4.4 |
| Nevada | 25 | 3.7 |
| Oklahoma | 22 | 3.3 |
| Florida | 28 | 3.2 |
| Indiana | 24 | 3.1 |
| Kentucky | 24 | 2.9 |
| Mississippi | 25 | 2.8 |
You can review the full state-by-state data.
Illinois tops the ranking at 11.4 fatal crashes per 10,000 commuters, where only 0.8% of residents use public transit. Wisconsin follows closely at 11.2, despite having the shortest average commute in the top 10 at 18 minutes. Vermont, Tennessee, and Nevada round out the top five, with Nevada also posting the highest public transit use in the group at 2.9%.
How Oklahoma Compares
Oklahoma ranks sixth nationally, with 3.3 fatal crashes per 10,000 commuters and an average commute time of 22 minutes. Only 0.5% of Oklahoma commuters use public transportation. In the last five years, Florida recorded 54 fatal commuting crashes and Nevada recorded 17, the two state totals captured in the underlying research.

Clayton T. Hasbrook, Managing Attorney, commented on the findings: “The accident statistics show a concerning pattern where states heavily reliant on personal vehicles face significantly higher commuter risk profiles. The connection between car dependency, extended travel times, and elevated crash incidents highlights a critical infrastructure challenge facing American communities.”


What This Means if You’re Hurt During Your Commute
A crash that happens on the way to or from work is treated like any other Oklahoma car accident claim. Oklahoma follows a comparative negligence rule: you can still recover damages as long as your own share of fault does not exceed 50 percent, and at exactly 50 percent you still recover, with your award reduced by your percentage of fault (23 O.S. § 13). Our page on how comparative fault is applied in an Oklahoma car accident claim covers how insurers use this rule to try to reduce a payout.
Oklahoma law also requires drivers to carry at least $25,000 per person and $50,000 per accident in bodily injury liability coverage, plus $25,000 in property damage coverage (47 O.S. § 7-103(2)(b)). Those minimums often fall short in a serious crash. If the other driver’s coverage isn’t enough to pay for your injuries, your own uninsured or underinsured motorist coverage may be able to make up the difference.
If a commuting crash left you or a family member injured, talk with legal help for an Oklahoma City commuting crash before you accept an insurance settlement. Hasbrook & Hasbrook represents injured commuters across the Oklahoma City metro; tell our team what happened and we’ll walk you through your options. For a related look at driving risk nationwide, see our analysis of the states with the most reckless drivers.